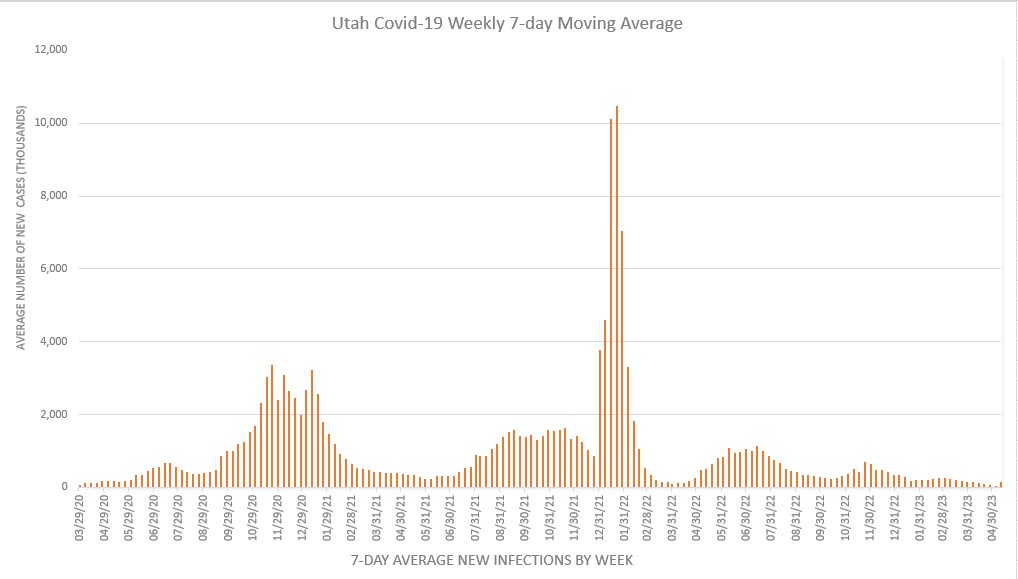
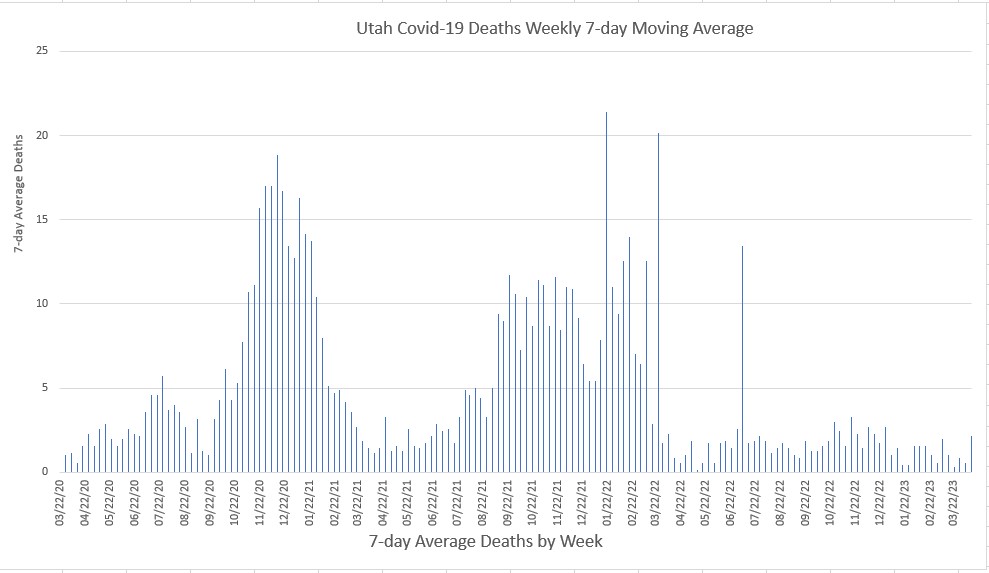
Johns Hopkins University stopped tracking the pandemic on March 10, 2023.
So here is the final data for Utah. Note: The final week saw some county/regional health departments rush to get in their last data. That upped the final averages in an unrealistic way.
Utah reported the following data:
Below are the complete graphs from the beginning of the pandemic through May 14, 2023.- Total cases 1,098,011
- Total deaths 5,374
For the U.S. Centers for Disease Control (CDC) reported the following as of May 13, 2023.
- >Hospitalizations 6,152,982
- >Deaths 1,128,903


Likewise the United States is doing well. East coast states are starting to recognized a uptrend in infections from Omicron-2 (BA.2).
Asia is still bad with Omicron 1 and Europe is fighting Omicron 2. The U.S. had under 1,000,000 cases in March out of 80,000,000 total. That said at some time in April the U.S. will record the 1,000,000th death from the virus.
South Korea reached an infection rate of 27% with over 15,000,00 infections in March. Vietnam once like China with few infections raced to a total of over 9 million, but their infection rate is still below 10%. Other nations including Thailand were not nearly as
Taiwan has an infection rate of only 0.10%, the same as China but China has 60 times the population of Taiwan.
In Europe Germany, France and Greece are elevated with around a 10% infection rate for March. Other nations are less, for example, Spain was under 2%. My guess is that the U.S. will have about a 2% infection rate at the max of Omicron 2, because like Spain the U.S. had high infection rates prior to Omicron 2 arriving.
Total pandemic infection rates in Asia are much lower than in Europe, the United States, or Brazil.
| Country | 2010 Population | Total Infected Count | Overall Infection Rate | Infected Total Last 2 Weeks | Infected Last 2 Weeks | Infection Rate last 2 weeks | Infected Prior 2 Weeks | Total Deaths | Overall Death Rate | Total Deaths 2 wks ago | Deaths Last 2 Weeks | Death Rate Last 2 weeks |
| ASIA | ||||||||||||
| China | 1,433,783,686 | 1,429,495 | 0.10% | 1,178,070 | 251,425 | 0.02% | 251,425 | 12,810 | 0.90% | 10,534 | 2,276 | 0.19% |
| India | 1,366,417,754 | 43,028,131 | 3.15% | 43,007,841 | 20,290 | 0.00% | 20,290 | 521,345 | 1.21% | 516,479 | 4,866 | 0.01% |
| Japan | 126,860,301 | 6,700,637 | 5.28% | 6,100,331 | 600,306 | 0.47% | 600,306 | 28,287 | 0.42% | 27,122 | 1,165 | 0.02% |
| Philippines | 108,116,615 | 3,679,629 | 3.40% | 3,674,286 | 5,343 | 0.00% | 5,343 | 59,343 | 1.61% | 58,263 | 1,080 | 0.03% |
| Viet Nam | 96,462,106 | 9,716,282 | 10.07% | 7,791,841 | 1,924,441 | 2.00% | 1,924,441 | 42,563 | 0.44% | 41,817 | 746 | 0.01% |
| Thailand | 69,625,582 | 3,711,595 | 5.33% | 3,353,969 | 357,626 | 0.51% | 357,626 | 25,415 | 0.68% | 24,246 | 1,169 | 0.03% |
| S. Korea | 51,225,308 | 13,874,216 | 27.08% | 9,373,646 | 4,500,570 | 8.79% | 4,500,570 | 17,235 | 0.12% | 12,428 | 4,807 | 0.05% |
| Taiwan | 23,773,876 | 24,312 | 0.10% | 21,905 | 2,407 | 0.01% | 2,407 | 853 | 3.51% | 853 | 0 | 0.00% |
| Hong Kong | NA | |||||||||||
| Country | Population | Total Infected Count | Overall Infection Rate | Infected Total Last 2 Weeks | Infected Last 2 Weeks | Infection Rate last 2 weeks | Infected Prior 2 Weeks | Total Deaths | Overall Death Rate | Deaths Last 28 Days | Deaths Last 2 Weeks | Death Rate Last 2 weeks |
| EUROPE | ||||||||||||
| Russia | 145,961,031 | 17,636,019 | 12.08% | 17,317,818 | 318,201 | 0.22% | 318,201 | 362,304 | 2.05% | 357,234 | 5,070 | 0.03% |
| Germany | 83,517,045 | 21,665,200 | 25.94% | 18,730,442 | 2,934,758 | 3.51% | 2,934,758 | 130,209 | 0.60% | 126,920 | 3,289 | 0.02% |
| U.K. | 67,530,172 | 21,379,545 | 31.66% | 20,243,940 | 1,135,605 | 1.68% | 1,135,605 | 166,168 | 0.78% | 164,099 | 2,069 | 0.01% |
| France | 65,129,728 | 26,186,606 | 40.21% | 24,241,956 | 1,944,650 | 5.00% | 1,944,650 | 143,540 | 0.55% | 141,931 | 1,609 | 0.01% |
| Italy | 60,550,075 | 14,845,815 | 24.52% | 13,861,743 | 984,072 | 1.63% | 984,072 | 159,784 | 1.08% | 157,785 | 1,999 | 0.01% |
| Spain | 46,692,858 | 11,551,574 | 24.74% | 11,324,637 | 226,937 | 0.49% | 226,937 | 102,541 | 0.89% | 101,703 | 838 | 0.01% |
| Greece | 10,473,455 | 3,077,711 | 29.39% | 2,788,654 | 289,057 | 2.76% | 289,057 | 27,684 | 0.90% | 26,937 | 747 | 0.03% |
| Sweden | 10,036,379 | 2,487,852 | 24.79% | 2,455,966 | 31,886 | 0.32% | 31,886 | 18,365 | 0.74% | 18,053 | 312 | 0.01% |
| Country | Population | Total Infected Count | Overall Infection Rate | Infected Total Last 2 Weeks | Infected Last 2 Weeks | Infection Rate last 2 weeks | Infected Prior 2 Weeks | Total Deaths | Overall Death Rate | Deaths Last 28 Days | Deaths Last 2 Weeks | Death Rate Last 2 weeks |
| AMERICAS | ||||||||||||
| U.S.A | 329,064,917 | 80,151,387 | 24.36% | 79,733,159 | 418,228 | 0.13% | 418,228 | 982,533 | 1.23% | 971,162 | 11,371 | 0.01% |
| Canada | 37,411,047 | 3,506,282 | 9.37% | 3,434,964 | 71,318 | 0.19% | 71,318 | 37,728 | 1.08% | 37,215 | 513 | 0.01% |
| Brazil | 212,559,417 | 29,995,575 | 14.11% | 29,584,800 | 410,775 | 0.19% | 410,775 | 660,533 | 2.20% | 657,389 | 3,144 | 0.01% |
| Middle East | ||||||||||||
| Iran | 82,913,906 | 7,167,646 | 8.64% | 7,141,033 | 26,613 | 0.03% | 26,613 | 140,315 | 1.96% | 139,610 | 705 | 0.01% |
| Turkey | 83,809,754 | 14,894,731 | 17.77% | 14,693,917 | 200,814 | 0.24% | 200,814 | 98,157 | 0.66% | 97,267 | 890 | 0.01% |
| Other | ||||||||||||
| Australia | 25,203,198 | 3,903,113 | 15.49% | 3,903,113 | 0 | 0.00% | 37,522 | 5,730 | 0.15% | 5,730 | 0 | 0.00% |
The Centers for Disease Control (Atlanta GA) reported that they believe 58% of all Americans have antibodies from actual infection by the SARS-CoV-2 virus. If you add that to those who are fully vaccinated and boosted, you have a number that is approaching herd immunity. We just don't know how many were vaccinated and then infected by the virus, which could impact these numbers.
In any case, this "surge" is likely to be muted by numbers that are near herd immunity.
Last Thursday's data from the Utah Department of Health shows that the BA.2 ramp in infection has arrived. Reported cases jumped from 106/day the prior week to 171/day this last week. 171/day is the highest number since the week of March 11. My guess is that cases will rise to 300-500/day before again receding.
We know that with the broad distribution of at-home test kits not all cases are reported. We just don't know how many. The state is now actively tracing sewage content to monitor spread, and that has been rising for 3 weeks now.
Deaths from Covid-19 remain at 1 per day. Utah does such in-depth investigation of Covid-19 deaths that it can be 30 days or more before they are reported.
The Wall Street Journal reported that Utah was #1 in addressing the pandemic. Too bad they left out infection rate from their metrics. Yes, Utah's economy did well, and deaths from Covid-19 were the lowest in the nation. This was mostly due to Utah's population being younger and more healthy than almost all states. Utah failed at controlling the spread of the disease as shown by a top 10 rating in infection rate. Lower the spread, lower the deaths.