This is the third report using a new monthly report on the SARS-CoV-2 global pandemic.Johns Hopkins University started to provide a new data elements which are last 28 day infections and last 28 day deaths. These are now included in the data table below.
See Weekly data for Utah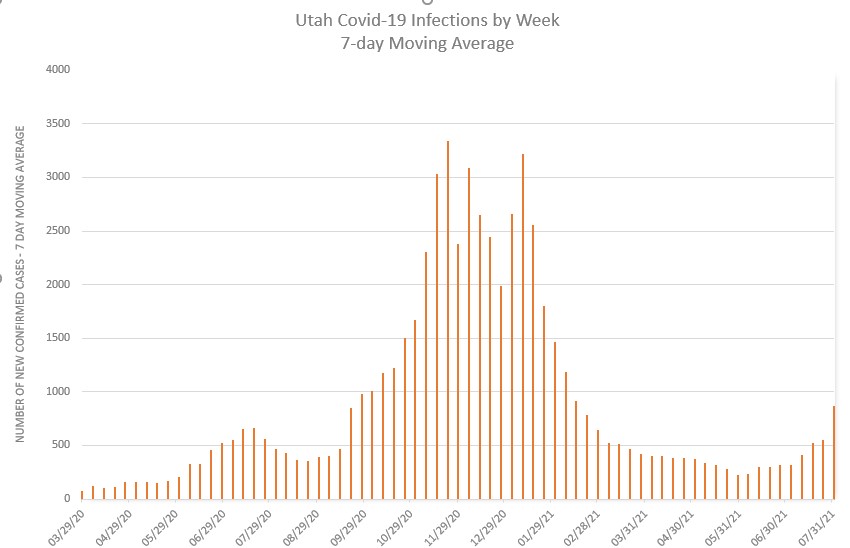
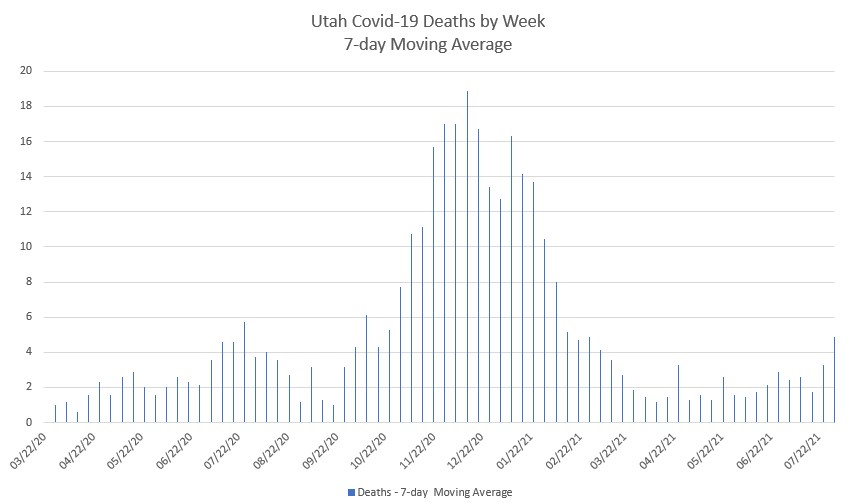
The scourge of the delta variant remain strong in Utah continues to go up. the 7-day average of new infections has reached 1,325 new daily infections the highest since late October 2020. Deaths are now averaging 5 per day. Utah's death rate has gone up to 0.57% fro, 0.50%, but remains one of the best in the United States.
The 10 states with the most cases (population adjusted) are (worst to best) Mississippi, Louisiana, Tennessee, South Carolina, Alabama, Kentucky, Florida, Georgia, Arkansas. As you can see all of these states are in the Southeast part of the United States.
The 10 states with the least cases (population adjusted are (best to worst) Pennsylvania, Maryland, Connecticut, Maine, New Hampshire, Michigan, Vermont, Massachusetts, New Jersey, New York, Minnesota. As you can see all of these states are in the Northeastern part of the United States, except for Michigan and Minnesota which are both northern states. Utah ranked 25th best (right in the middle of the pack).
Hawaii had almost 1/3 of all its cases during the last 28 days.
Asia (in particular south Asia) continues to be hard hit. For example here are the number of cases in the last 28 days. India (1,054,218), Japan (544748), Philippines (411743), Thailand (528560), Vietnam (511,170).
In Europe, the U.K., France, and Greece are somewhat better than the United States. Other European nations are doing much better.
In the Americas, Brazil has improved a lot in the last month. Canada beats the U.S. on all statistics except for the death rate which is a bit higher than that of the United States.
Australia had almost 1/3 of its 61,609 cases in the last 28 days. Again except for the death rate, they look much better than the United States.
| Country | Population | Infected Current Count | Infected Prior Count | This Period Infection Count | Per Week | Infection Rate | Dead Current Count | Dead Prior Count | This Period Dead Count | Per Week | Death Rate | ||
| Weeks in Period | 5 | ||||||||||||
| ASIA | |||||||||||||
| China | 1,433,783,686 | 103,633 | 102,960 | 673 | 135 | 0.01% | 4,847 | 4,846 | 1 | 0 | 4.68% | ||
| India | 1,366,417,754 | 30,545,433 | 27,894,800 | 2,650,633 | 530,127 | 2.24% | 402,005 | 299,266 | 102,739 | 20,548 | 1.32% | ||
| Japan | 126,860,301 | 807,178 | 745,392 | 61,786 | 12,357 | 0.64% | 14,793 | 12,265 | 2,528 | 506 | 1.83% | ||
| Philippenes | 108,116,615 | 1,436,369 | 1,223,627 | 212,742 | 42,548 | 1.33% | 25,149 | 19,951 | 5,198 | 1,040 | 1.75% | ||
| Viet Nam | 96,462,106 | 19,310 | 7,107 | 12,203 | 2,441 | 0.02% | 86 | 42 | 44 | 9 | 0.45% | ||
| Thailand | 69,625,582 | 296,067 | 156,370 | 139,697 | 27,939 | 0.43% | 2,226 | 776 | 1,450 | 290 | 0.75% | ||
| S. Korea | 51,225,308 | 160,084 | 139,910 | 20,174 | 4,035 | 0.31% | 2,026 | 1,931 | 95 | 19 | 1.27% | ||
| Taiwan | 23,773,876 | 15,030 | 8,160 | 6,870 | 1,374 | 0.06% | 688 | 17 | 671 | 134 | 4.58% | ||
| Hong Kong | 7,436,154 | 11,942 | 11,837 | 105 | 21 | 0.16% | 211 | 210 | 1 | 0 | 1.77% | ||
| Country | Population | Infected Current Count | Infected Prior Count | This Period Infection Count | Per Week | Infection Rate | Dead Current Count | Dead Prior Count | This Period Dead Count | Per Week | Death Rate | ||
| EUROPE | |||||||||||||
| Russia | 145,961,031 | 5,544,199 | 5,005,171 | 539,028 | 107,806 | 3.80% | 135,636 | 116,497 | 19,139 | 3,828 | 2.45% | ||
| Germany | 83,517,045 | 3,738,868 | 3,687,715 | 51,153 | 10,231 | 4.48% | 91,039 | 87,395 | 3,644 | 729 | 2.43% | ||
| U.K. | 67,530,172 | 4,920,156 | 4,499,934 | 420,222 | 84,044 | 7.29% | 128,486 | 127,983 | 503 | 101 | 2.61% | ||
| France | 65,129,728 | 5,845,622 | 5,728,418 | 117,204 | 23,441 | 8.98% | 111,314 | 108,358 | 2,956 | 591 | 1.90% | ||
| Italy | 60,550,075 | 4,263,317 | 4,192,183 | 71,134 | 14,227 | 7.04% | 127,649 | 125,225 | 2,424 | 485 | 2.99% | ||
| Spain | 46,692,858 | 3,833,868 | 3,636,453 | 197,415 | 39,483 | 8.21% | 80,911 | 79,620 | 1,291 | 258 | 2.11% | ||
| Greece | 10,473,455 | 425,964 | 389,804 | 36,160 | 7,232 | 4.07% | 12,716 | 11,772 | 944 | 189 | 2.99% | ||
| Sweden | 10,036,379 | 1,090,880 | 1,058,341 | 32,539 | 6,508 | 10.87% | 14,631 | 14,366 | 265 | 53 | 1.34% | ||
| Country | Population | Infected Current Count | Infected Prior Count | This Period Infection Count | Per Week | Infection Rate | Dead Current Count | Dead Prior Count | This Period Dead Count | Per Week | Death Rate | ||
| AMERICAS | |||||||||||||
| U.S.A | 329,064,917 | 33,715,658 | 33,258,547 | 457,111 | 91,422 | 10.25% | 605,508 | 589,879 | 15,629 | 3,126 | 1.80% | ||
| Canada | 37,411,047 | 1,424,245 | 1,386,358 | 37,887 | 7,577 | 3.81% | 26,314 | 25,200 | 1,114 | 223 | 1.85% | ||
| Brazil | 212,559,417 | 18,742,025 | 16,515,120 | 2,226,905 | 445,381 | 8.82% | 523,587 | 448,208 | 75,379 | 15,076 | 2.79% | ||
| Middle East | |||||||||||||
| Iran | 82,913,906 | 3,254,818 | 2,902,094 | 352,724 | 70,545 | 3.93% | 84,792 | 78,597 | 6,195 | 1,239 | 2.61% | ||
| Turkey | 83,809,754 | 5,440,368 | 5,242,911 | 197,457 | 39,491 | 6.49% | 49,847 | 46,268 | 3,579 | 716 | 0.92% |