This is the third report using a new monthly report on the SARS-CoV-2 global pandemic.Johns Hopkins University started to provide a new data elements which are last 28 day infections and last 28 day deaths. These are now included in the data table below. The tabular data and opening summary are as of September 5, 2021. See the August weekly data or Utah.


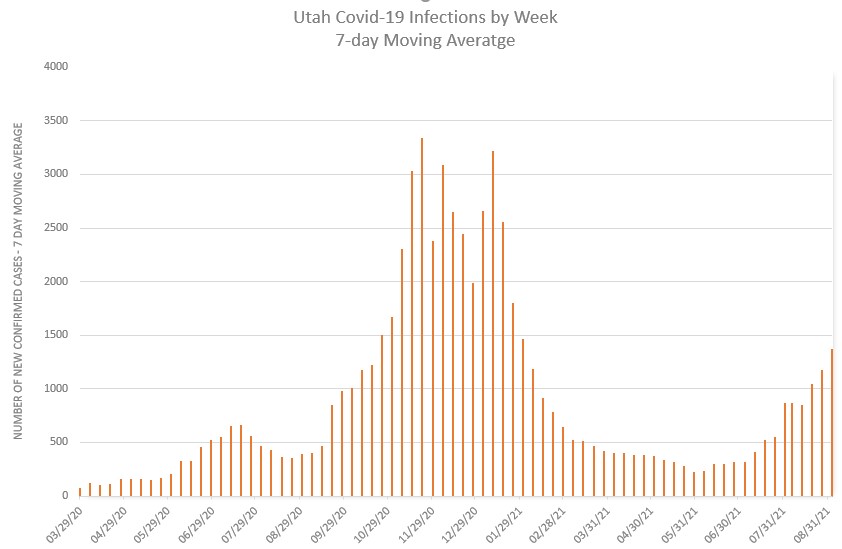
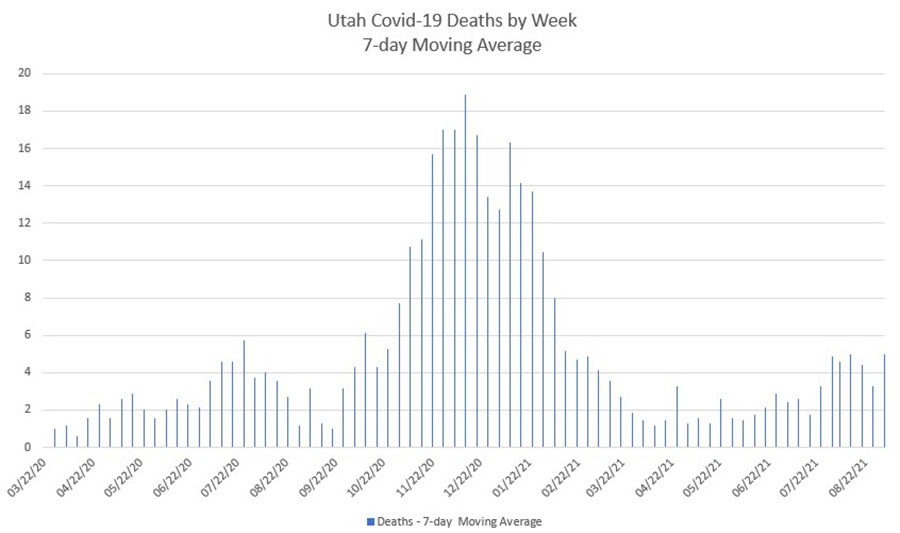
The scourge of the delta variant remain strong in Utah continues to go up. the 7-day average of new infections has reached 1,325 new daily infections the highest since late October 2020. Deaths are now averaging 5 per day. Utah's death rate has gone up to 0.57% fro, 0.50%, but remains one of the best in the United States.
The 10 states with the most cases (population adjusted) are (worst to best) Mississippi, Louisiana, Tennessee, South Carolina, Alabama, Kentucky, Florida, Georgia, Arkansas. As you can see all of these states are in the Southeast part of the United States.
The 10 states with the least cases (population adjusted are (best to worst) Pennsylvania, Maryland, Connecticut, Maine, New Hampshire, Michigan, Vermont, Massachusetts, New Jersey, New York, Minnesota. As you can see all of these states are in the Northeastern part of the United States, except for Michigan and Minnesota which are both northern states. Utah ranked 25th best (right in the middle of the pack).
Hawaii had almost 1/3 of all its cases during the last 28 days.
Asia (in particular south Asia) continues to be hard hit. For example here are the number of cases in the last 28 days. India (1,054,218), Japan (544748), Philippines (411743), Thailand (528560), Vietnam (511,170).
In Europe, the U.K., France, and Greece are somewhat better than the United States. Other European nations are doing much better.
In the Americas, Brazil has improved a lot in the last month. Canada beats the U.S. on all statistics except for the death rate which is a bit higher than that of the United States.
Australia had almost 1/3 of its 61,609 cases in the last 28 days. Again except for the death rate, they look much better than the United States.
| Country | Population | Infected Current Count | Infected Prior Count | This Period Infection Count | Per Week | Infection Rate | Dead Current Count | Dead Prior Count | This Period Dead Count | Per Week | Death Rate | ||
| Weeks in Period | 5 | ||||||||||||
| ASIA | |||||||||||||
| China | 1,433,783,686 | 105,057 | 102,960 | 2,097 | 419 | 0.01% | 4,848 | 4,847 | 1 | 0 | 4.61% | ||
| India | 1,366,417,754 | 31,655,824 | 27,894,800 | 3,761,024 | 752,205 | 2.32% | 424,351 | 402,005 | 22,346 | 4,469 | 1.34% | ||
| Japan | 126,860,301 | 937,234 | 745,392 | 191,842 | 38,368 | 0.74% | 15,211 | 14,793 | 418 | 84 | 1.62% | ||
| Philippenes | 108,116,615 | 1,597,689 | 1,223,627 | 374,062 | 74,812 | 1.48% | 28,016 | 25,149 | 2,867 | 573 | 1.75% | ||
| Viet Nam | 96,462,106 | 150,060 | 7,107 | 142,953 | 28,591 | 0.16% | 1,306 | 86 | 1,220 | 244 | 0.87% | ||
| Thailand | 69,625,582 | 615,314 | 156,370 | 458,944 | 91,789 | 0.88% | 4,990 | 2,226 | 2,764 | 553 | 0.81% | ||
| S. Korea | 51,225,308 | 199,787 | 139,910 | 59,877 | 11,975 | 0.39% | 2,098 | 2,026 | 72 | 14 | 1.05% | ||
| Taiwan | 23,773,876 | 15,688 | 8,160 | 7,528 | 1,506 | 0.07% | 789 | 688 | 101 | 20 | 5.03% | ||
| Hong Kong | 7,436,154 | 11,987 | 11,837 | 150 | 30 | 0.16% | 212 | 211 | 1 | 0 | 1.77% | ||
| Country | Population | Infected Current Count | Infected Prior Count | This Period Infection Count | Per Week | Infection Rate | Dead Current Count | Dead Prior Count | This Period Dead Count | Per Week | Death Rate | ||
| EUROPE | |||||||||||||
| Russia | 145,961,031 | 6,207,513 | 5,544,199 | 663,314 | 132,663 | 4.25% | 156,726 | 135,636 | 21,090 | 4,218 | 2.52% | ||
| Germany | 83,517,045 | 3,778,277 | 3,738,868 | 39,409 | 7,882 | 4.52% | 91,665 | 91,039 | 626 | 125 | 2.43% | ||
| U.K. | 67,530,172 | 5,907,592 | 4,920,156 | 987,436 | 197,487 | 8.75% | 130,014 | 128,486 | 1,528 | 306 | 2.20% | ||
| France | 65,129,728 | 6,209,934 | 5,845,622 | 364,312 | 72,862 | 9.53% | 112,073 | 111,314 | 759 | 152 | 1.80% | ||
| Italy | 60,550,075 | 4,355,348 | 4,263,317 | 92,031 | 18,406 | 7.19% | 128,068 | 127,649 | 419 | 84 | 2.94% | ||
| Spain | 46,692,858 | 4,447,044 | 3,833,868 | 613,176 | 122,635 | 9.52% | 81,486 | 80,911 | 575 | 115 | 1.83% | ||
| Greece | 10,473,455 | 494,907 | 425,964 | 68,943 | 13,789 | 4.73% | 12,950 | 12,716 | 234 | 47 | 2.62% | ||
| Sweden | 10,036,379 | 1,100,040 | 1,090,880 | 9,160 | 1,832 | 10.96% | 14,655 | 14,631 | 24 | 5 | 1.33% | ||
| Country | Population | Infected Current Count | Infected Prior Count | This Period Infection Count | Per Week | Infection Rate | Dead Current Count | Dead Prior Count | This Period Dead Count | Per Week | Death Rate | ||
| AMERICAS | |||||||||||||
| U.S.A | 329,064,917 | 34,991,571 | 33,715,658 | 1,275,913 | 255,183 | 10.63% | 613,214 | 605,508 | 7,706 | 1,541 | 1.75% | ||
| Canada | 37,411,047 | 1,438,817 | 1,424,245 | 14,572 | 2,914 | 3.85% | 26,561 | 26,314 | 247 | 49 | 1.85% | ||
| Brazil | 212,559,417 | 19,917,855 | 18,742,025 | 1,175,830 | 235,166 | 9.37% | 556,370 | 523,587 | 32,783 | 6,557 | 2.79% | ||
| Middle East | |||||||||||||
| Iran | 82,913,906 | 3,903,519 | 3,254,818 | 648,701 | 129,740 | 4.71% | 90,996 | 84,792 | 6,204 | 1,241 | 2.33% | ||
| Turkey | 83,809,754 | 5,727,045 | 5,440,368 | 286,677 | 57,335 | 6.83% | 51,332 | 49,847 | 1,485 | 297 | 0.90% |
Update on the spread of SARS-CoV-2 virus in Utah. Here are the raw statistics for the last few weeks on new infections. NOTE: The Utah Department of Health has not updated this information since Friday, August 6 - so the record for this week is missing two days
- 7/18 520 [3,643 cases]
- 7/25 543 [3,799 cases]
- 8/01 864 [6,049 cases]
- 8/08 859 [6,012 cases] Data incomplete
Update on the spread of SARS-CoV-2 virus in Utah. Here are the raw statistics for the last few weeks on new infections.
NOTE: The Utah department of health has stopped providing updates on Saturday and Sunday, thus from now on, starting August 6, the data will be from Friday rather than Sunday.
- 8/01 864 [6,049 cases]
- 8/06 859 [6,012 cases] Data for 5 days
- 8/13 844 [5,906 cases]
I see some hope that we are in a plateauing pattern from the last 3 weeks of data. I have real concerns about K-6 students (who cannot get vaccinated), but then 12 of my grandchildren are 10 and under, but the two youngest are not school age yet. I have four entering kindergartens this fall (none of which were holdbacks from last year).
For the latest week, the 7-day moving average reached 1,572 new cases, up 65 cases per day from the prior week. This is yet another new high since the start of the surge of the delta variant. Seven day average deaths was steady at 9. The number of cases traced to public school students and personnell now totals 5706 with just under 700 of those being administrators, teachers and staff. These numbers apply to the 2021-2022 school year which is 4 weeks old for some districts.
Looking at Covid-19 in Thailand.
Using today's data from John's Hopkins University:
- Cases last 28 days: 548,314
- Deaths last 28 days: 5,157
- Total cases 1,049,295
- Infection Rate: 1.5%
- Death Rate: 0.89%
Compare the above to data for the United States as of early August
- Infection rate: 10.63%
- Death rate: 1.75%
Still rising! The 7-day moving average of new cases reached 1174 as of Friday, August 27.
- 7/25 543 [3,799 cases]
- 8/1 864 [6,049 cases]
- 8/6 859 [6,012 cases] Data for 5 days. Utah stops Saturday and Sunday reporting.
- 8/13 844 [5,906 cases]
- 8/20 1039 [7270 cases]
- 8/27 1174 [8220 cases]
Over 95% of counties in the U.S. are in the high transmission category.